The FLOW framework is the diagnostic method Digital Efficiency Consulting Group uses to understand how work actually moves through an organization, identify where operational friction exists, and establish a factual foundation for workflow improvement decisions.
FLOW is used at the beginning of the DECG process because operational problems are often misunderstood at first. What leaders see as slow execution, poor follow-through, staffing strain, or system limitations is often the visible symptom of a deeper workflow issue. The purpose of FLOW is to examine the process directly so those issues can be understood through evidence rather than assumption.
In practice, the framework follows how work actually moves across people, teams, systems, approvals, and handoffs. It is designed to capture the real operating process, including bottlenecks, delays, rework, workarounds, and exception handling that may not appear in standard operating procedures or high-level process maps.
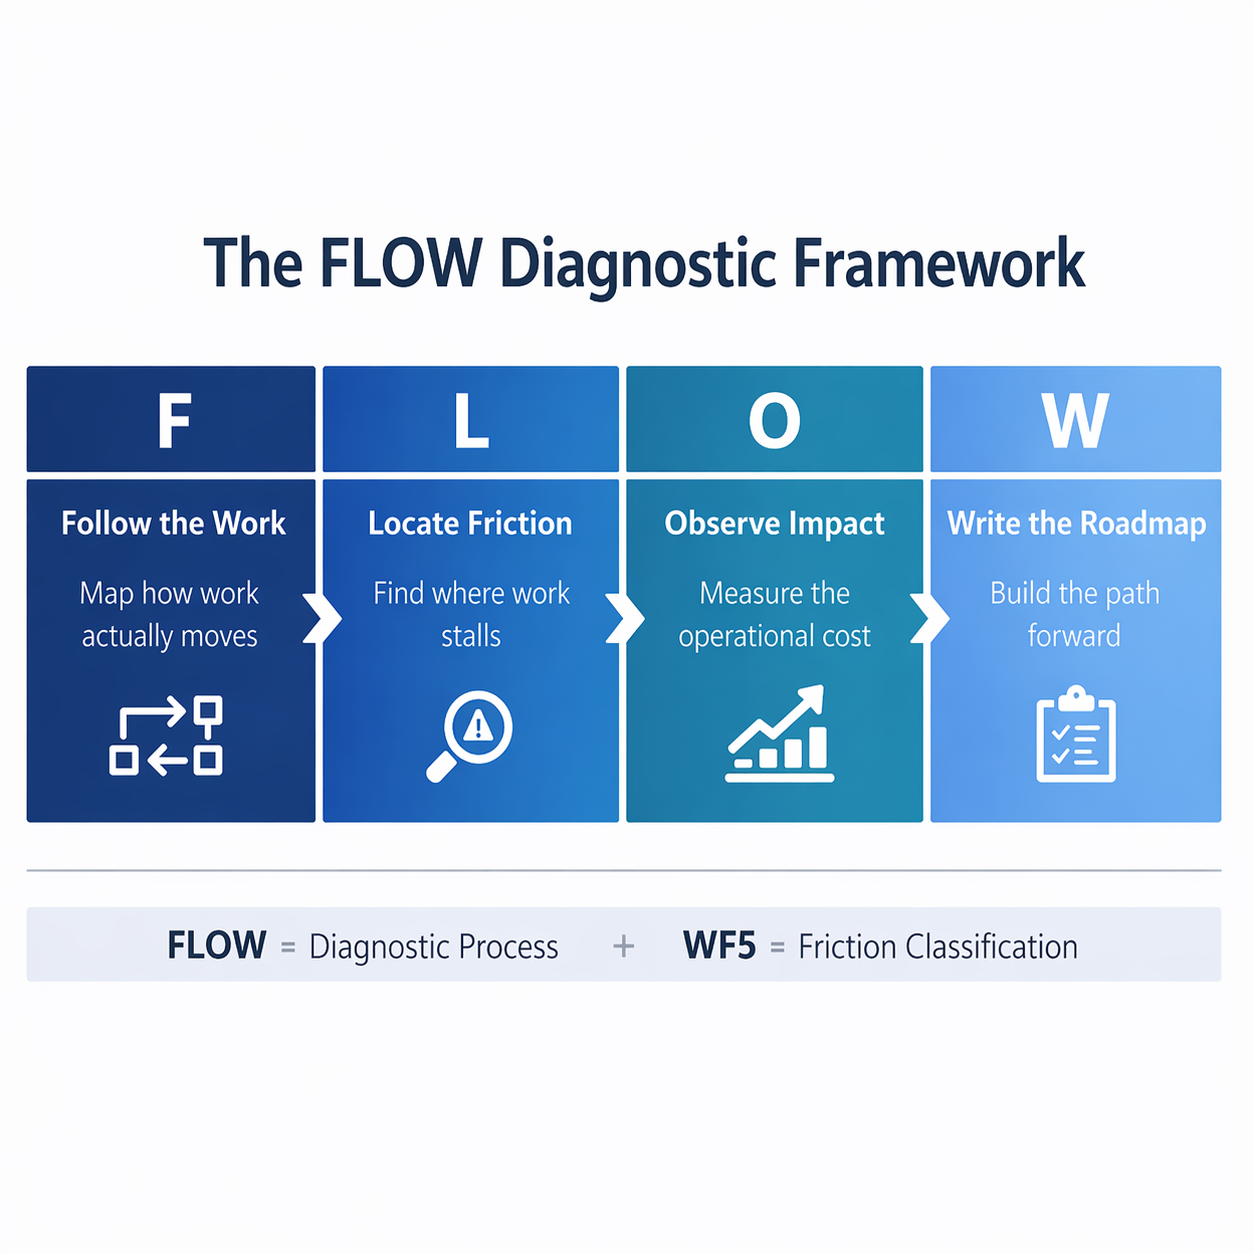
The name FLOW reflects the core sequence inside the framework: follow the work, locate friction, observe impact, and write the roadmap. Each part builds on the one before it. First, the work is traced from beginning to end. Next, points of drag or breakdown are identified. Then the effect of that friction is examined in terms of time, effort, coordination, or operational cost. Finally, those findings are organized into a structure that supports improvement planning.
This matters because organizations often try to solve workflow problems too early. They may jump to new tools, new rules, more oversight, or more labor before clearly understanding how the current process functions. FLOW slows that instinct down and replaces it with a structured diagnostic view of reality.
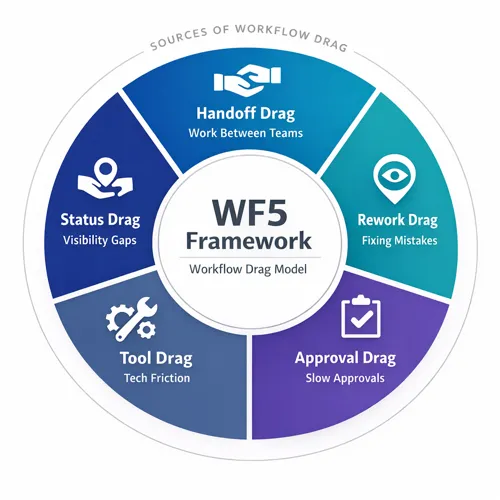
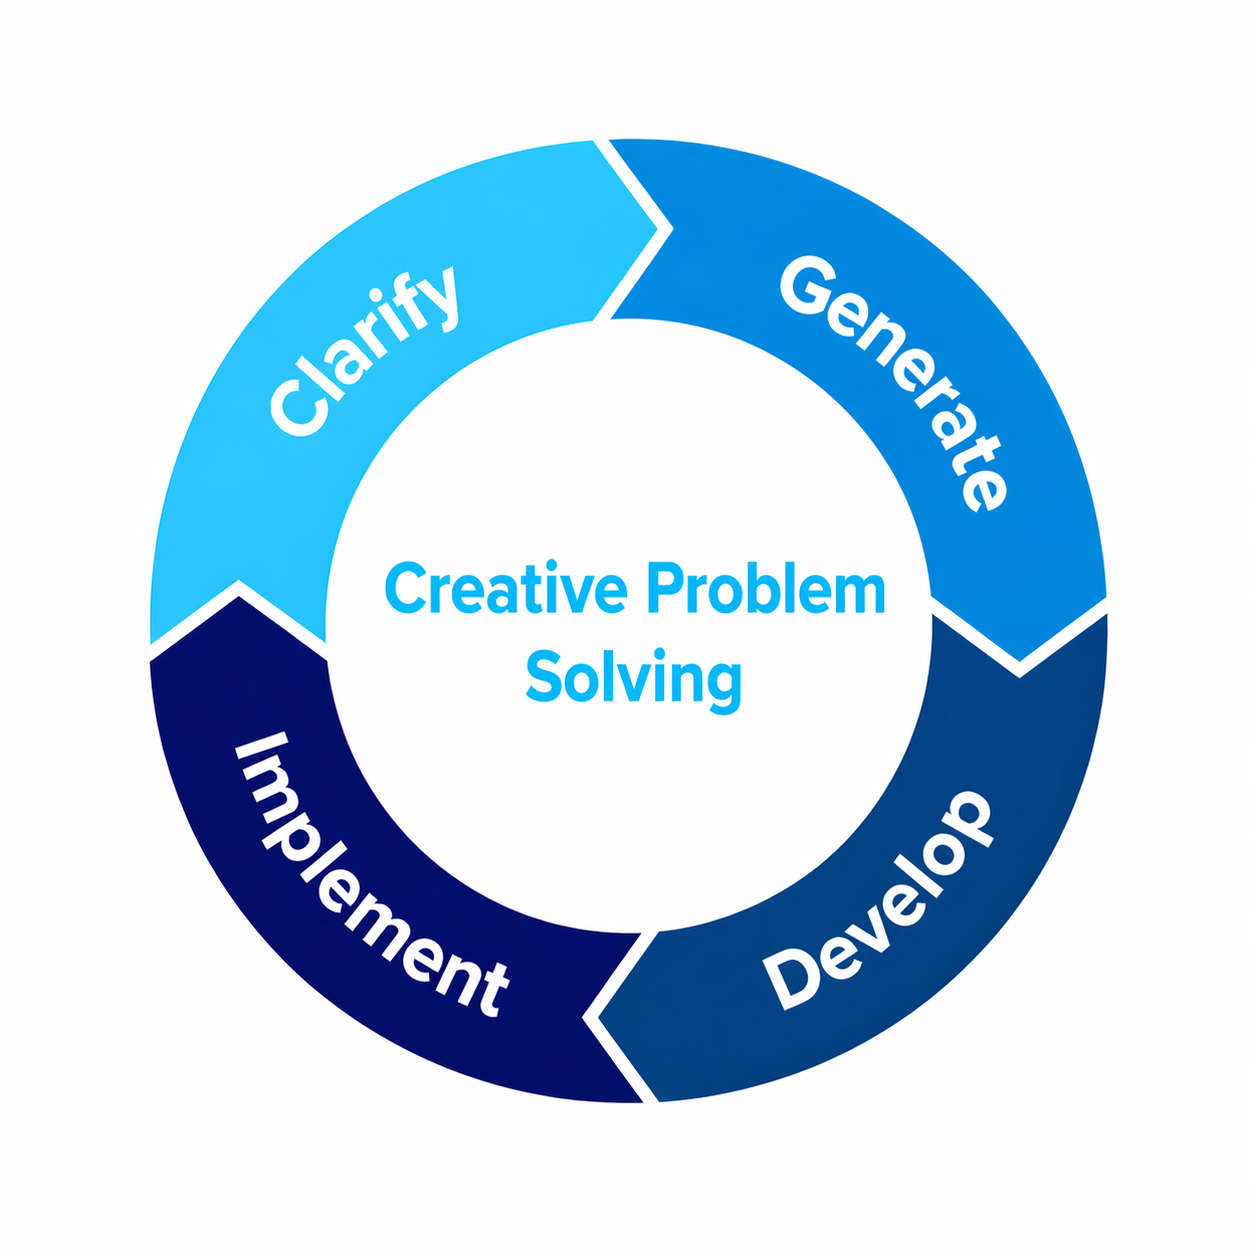
Within the DECG methodology, FLOW does not operate as a stand-alone recommendation engine. Its role is to produce the diagnostic clarity needed for the rest of the process. Once friction is identified through FLOW, DECG can classify the type of drag using the WF5 framework and then apply Creative Problem Solving to develop practical improvement options.
In short, FLOW is the part of the DECG process that finds where work is breaking, shows how that friction affects the organization, and creates the factual starting point for the Efficiency Blueprint.